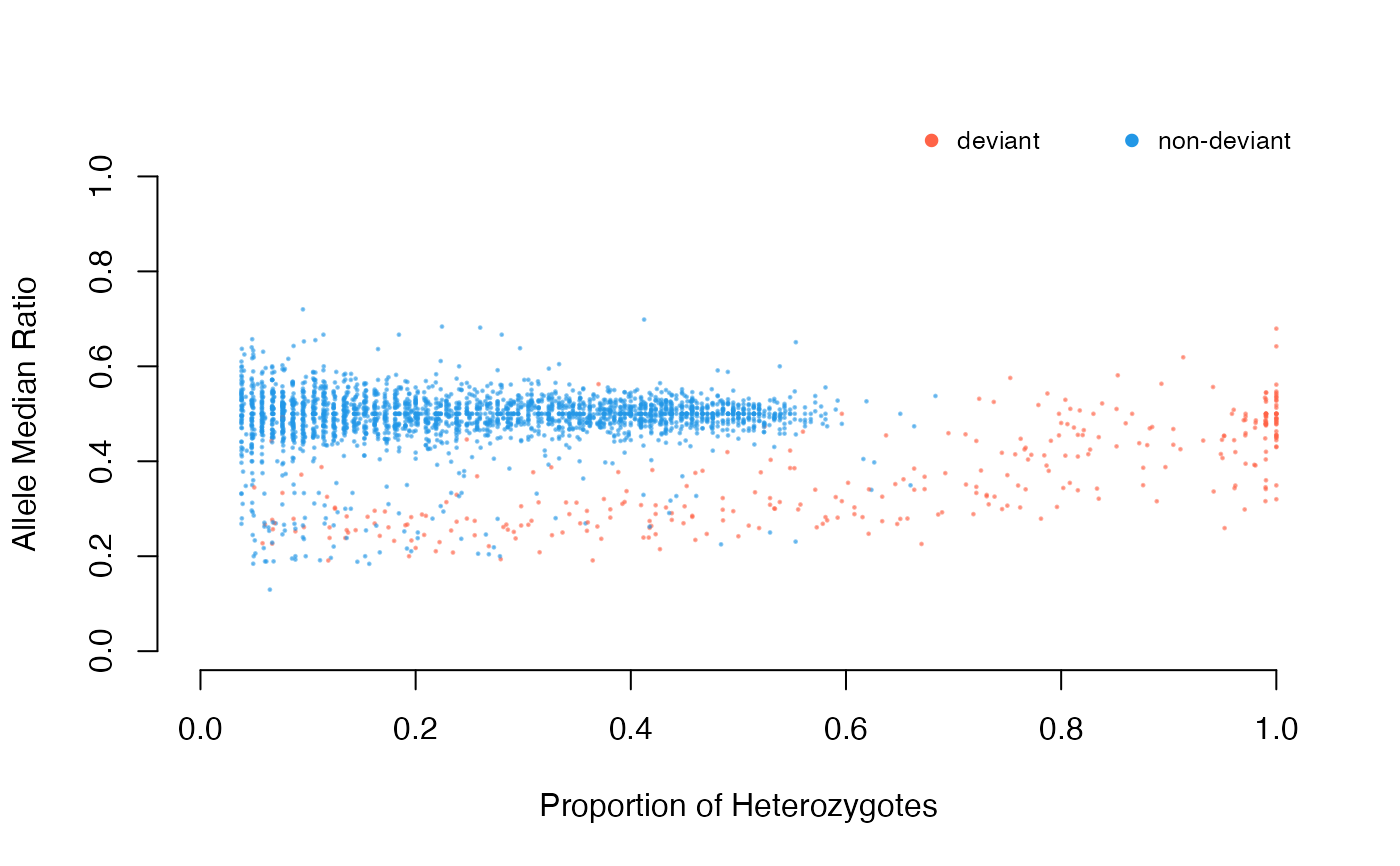
The function plots detected deviants/CNVs from functions sig.snps,
cnv and dupGet on a median ratio (MedRatio) Vs. proportion of
heterozygote (PropHet) plot.
Arguments
- ds
a data frame of detected deviants/cnvs (outputs of functions above)
- ...
other graphical parameters to be passed to the function
plot
Value
Returns no value, only plots proportion of heterozygotes vs allele
median ratio separated by duplication status
Author
Piyal Karunarathne
Examples
if (FALSE) data(alleleINF)
DD<-dupGet(alleleINF,plot=FALSE)
#> categorizing deviant SNPs with
#>  excess of heterozygotes z.all & chi.all
dup.plot(DD) # \dontrun{}