Get sequencing quality statistics of raw VCF files (with GatK generated vcf files only)
Source:R/statistics.R
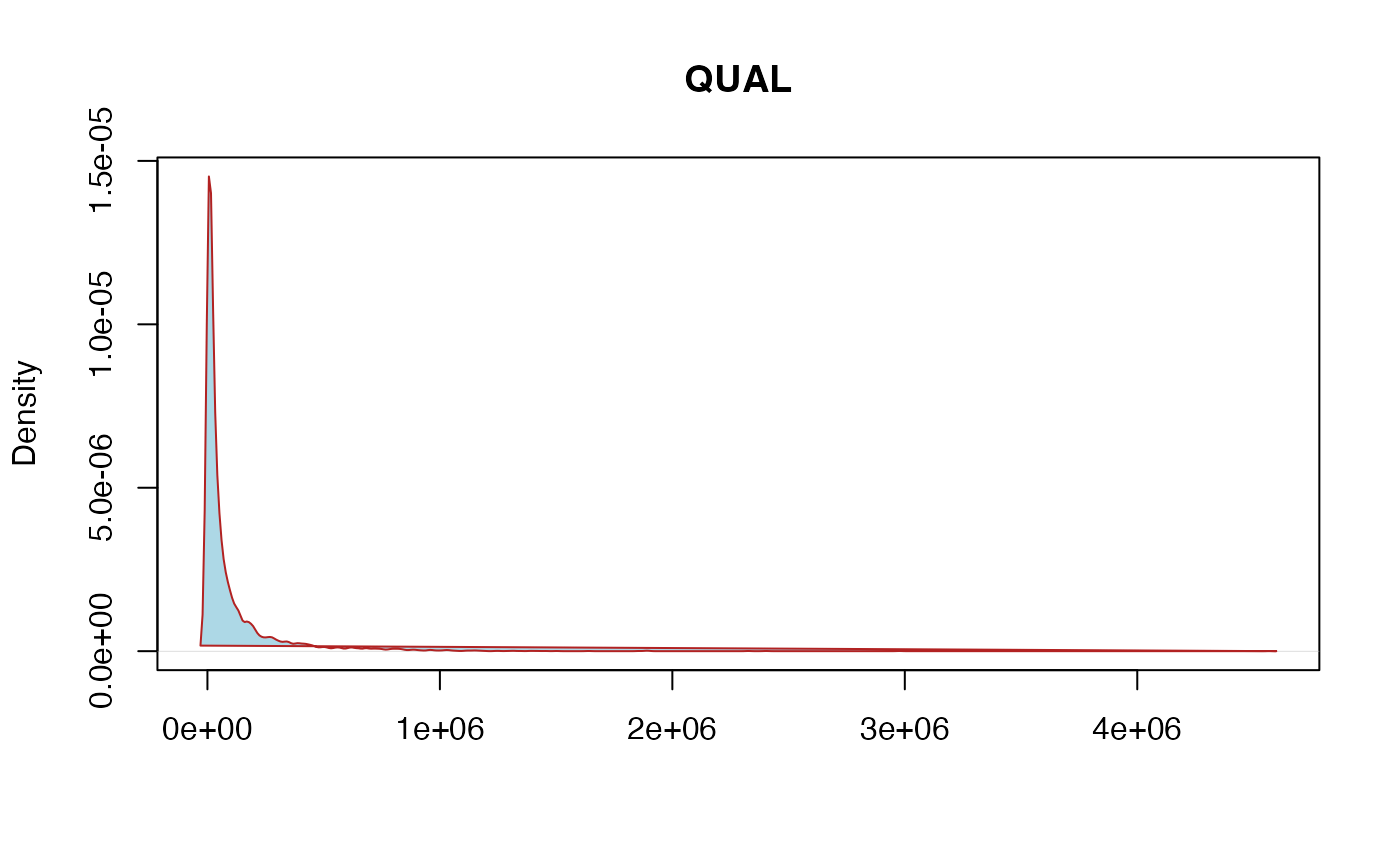
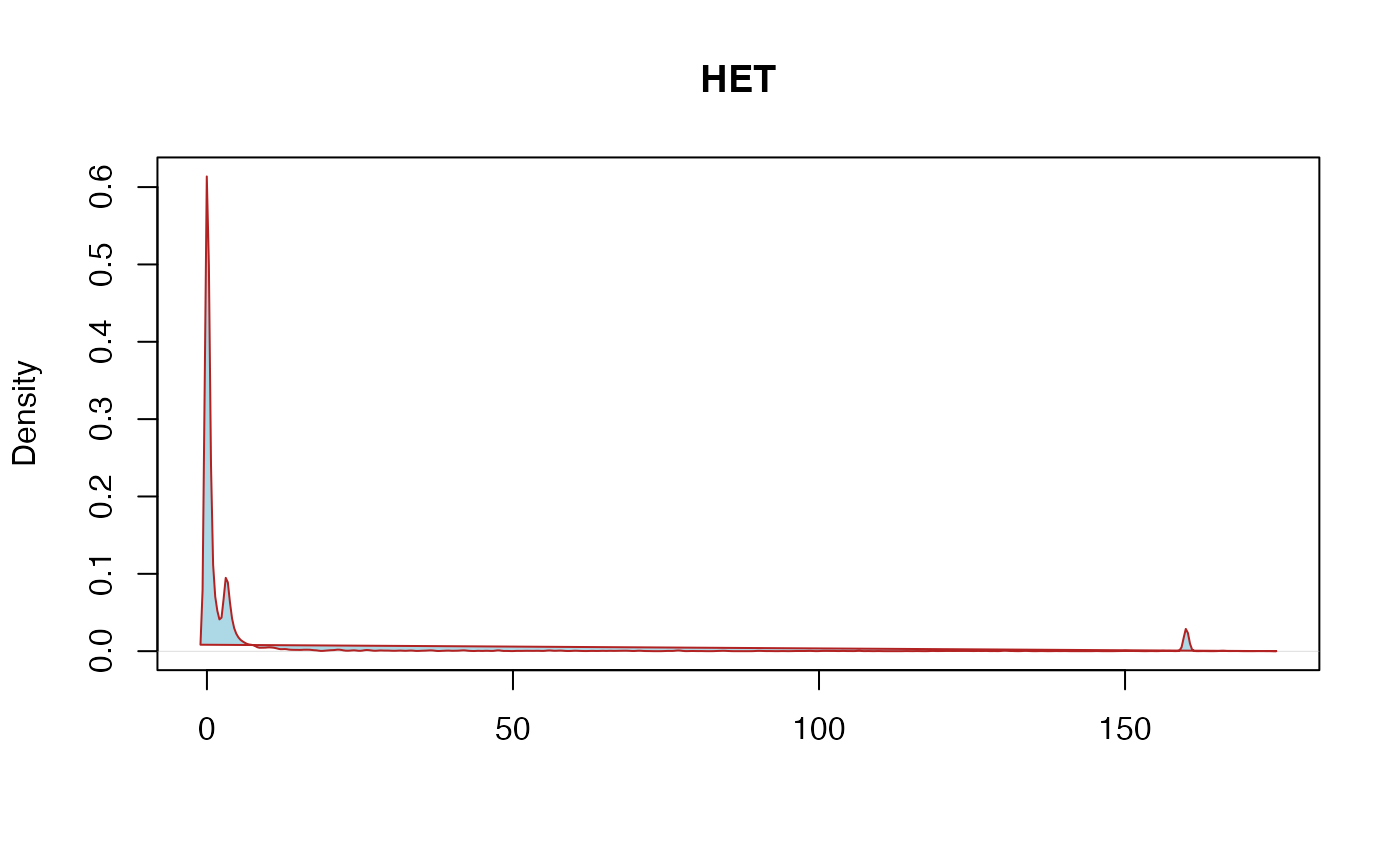
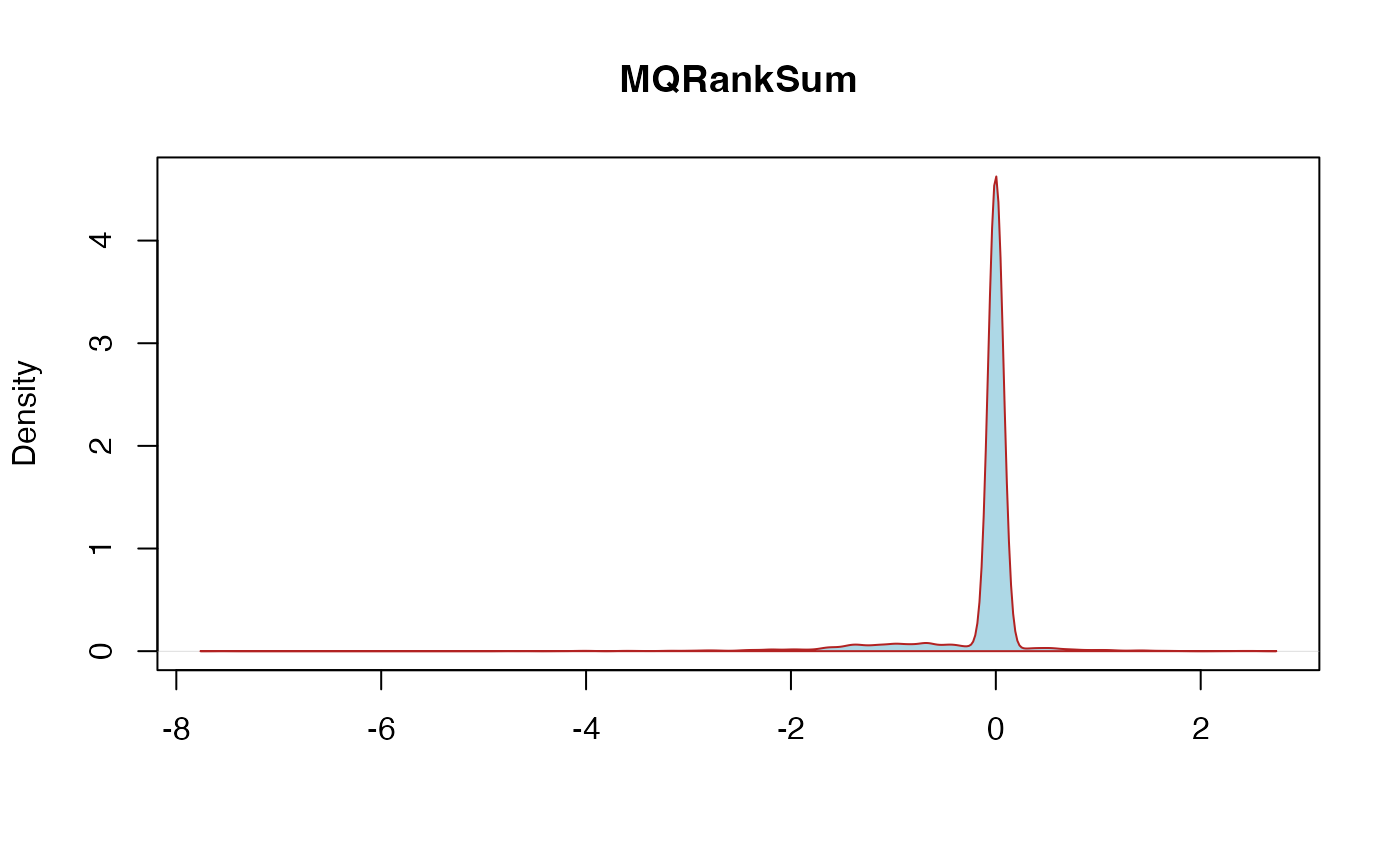
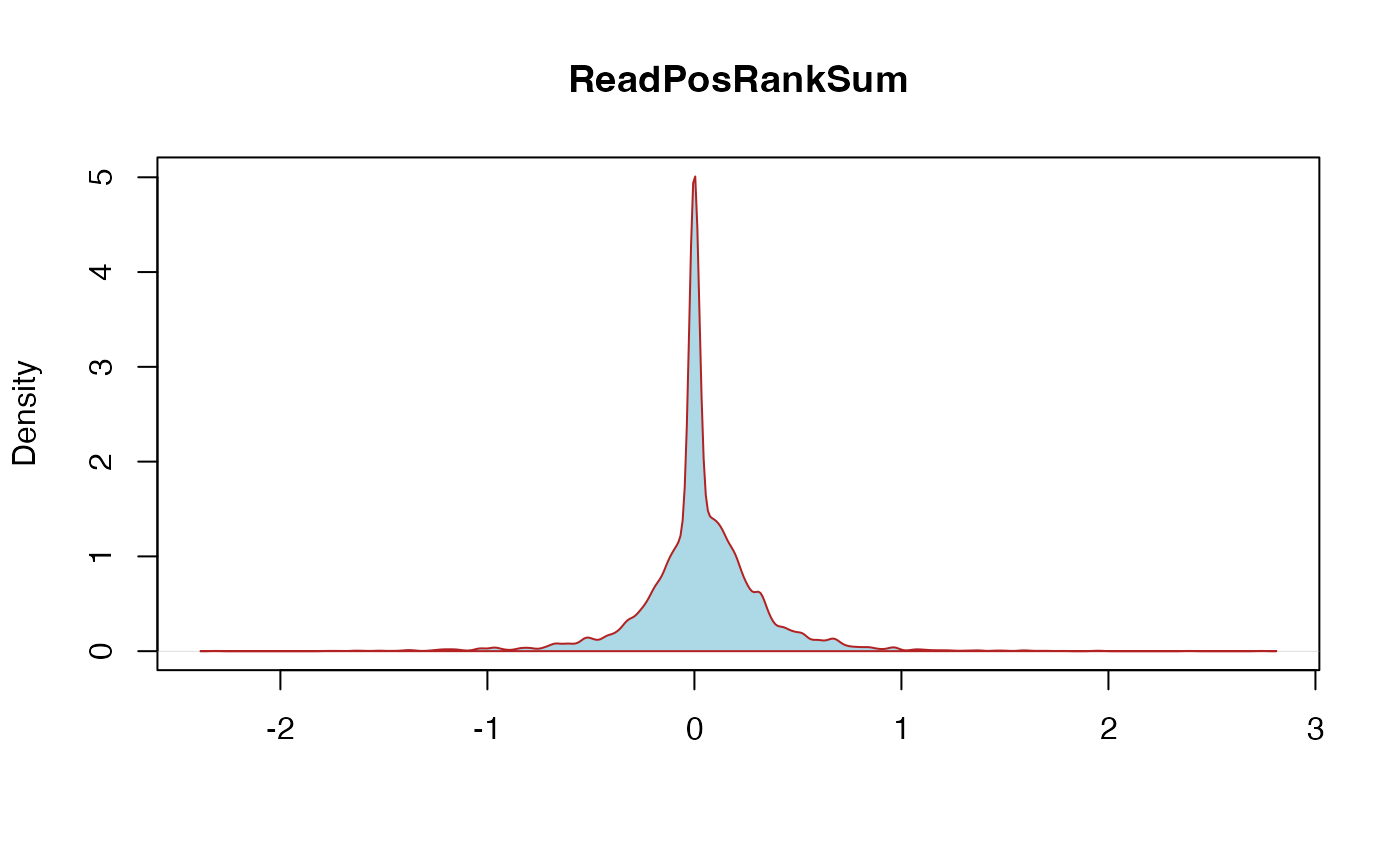
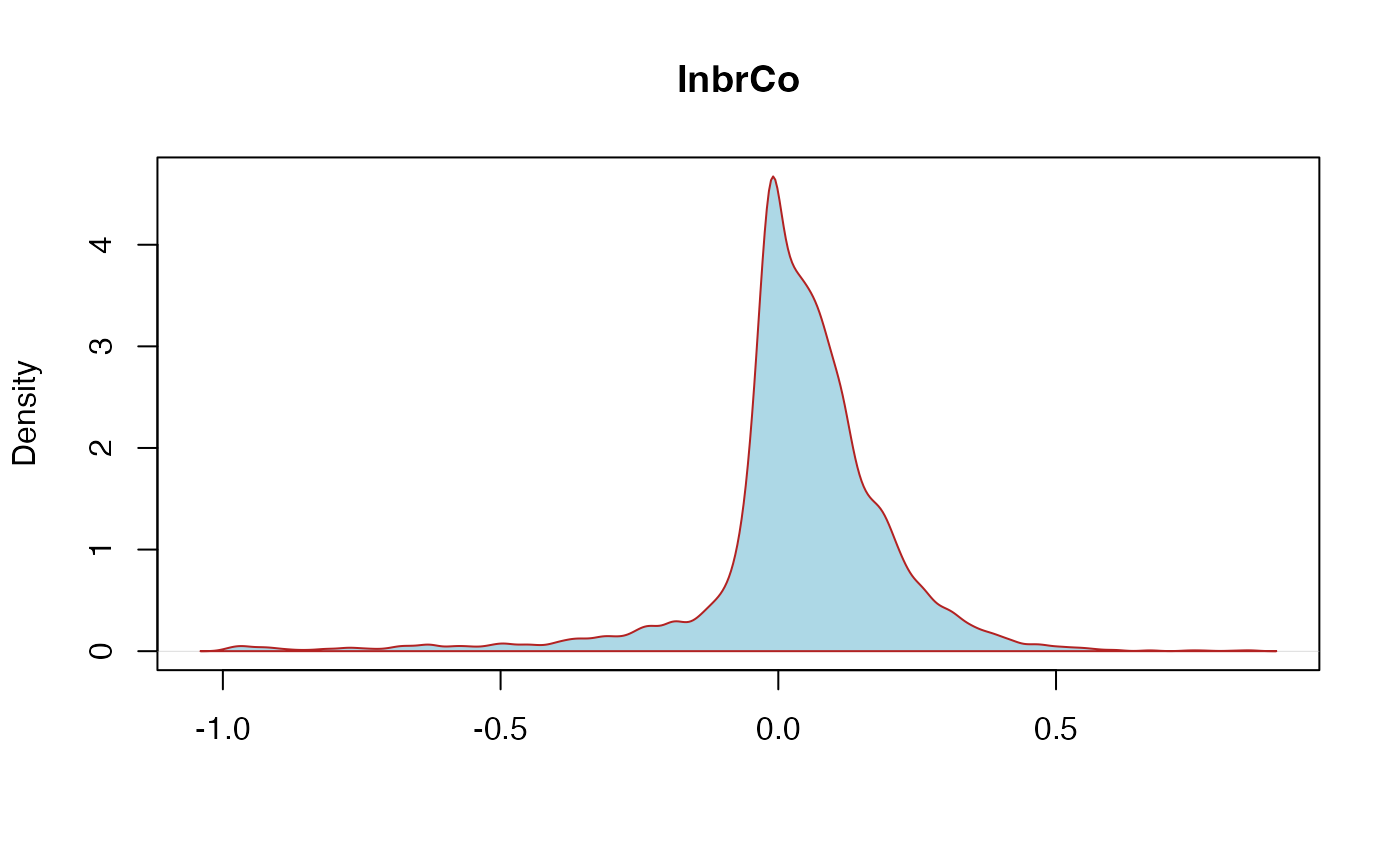
vcf.stat.RdThis function will generate a table similar to VariantsToTable option in GatK from raw vcf files for filtering purposes. The function will also plot all the parameters (see details & values).
Value
Returns a data frame with quality parameters from the INFO. field of the vcf
QUAL: The Phred-scaled probability that a REF/ALT polymorphism exists at this site given sequencing data
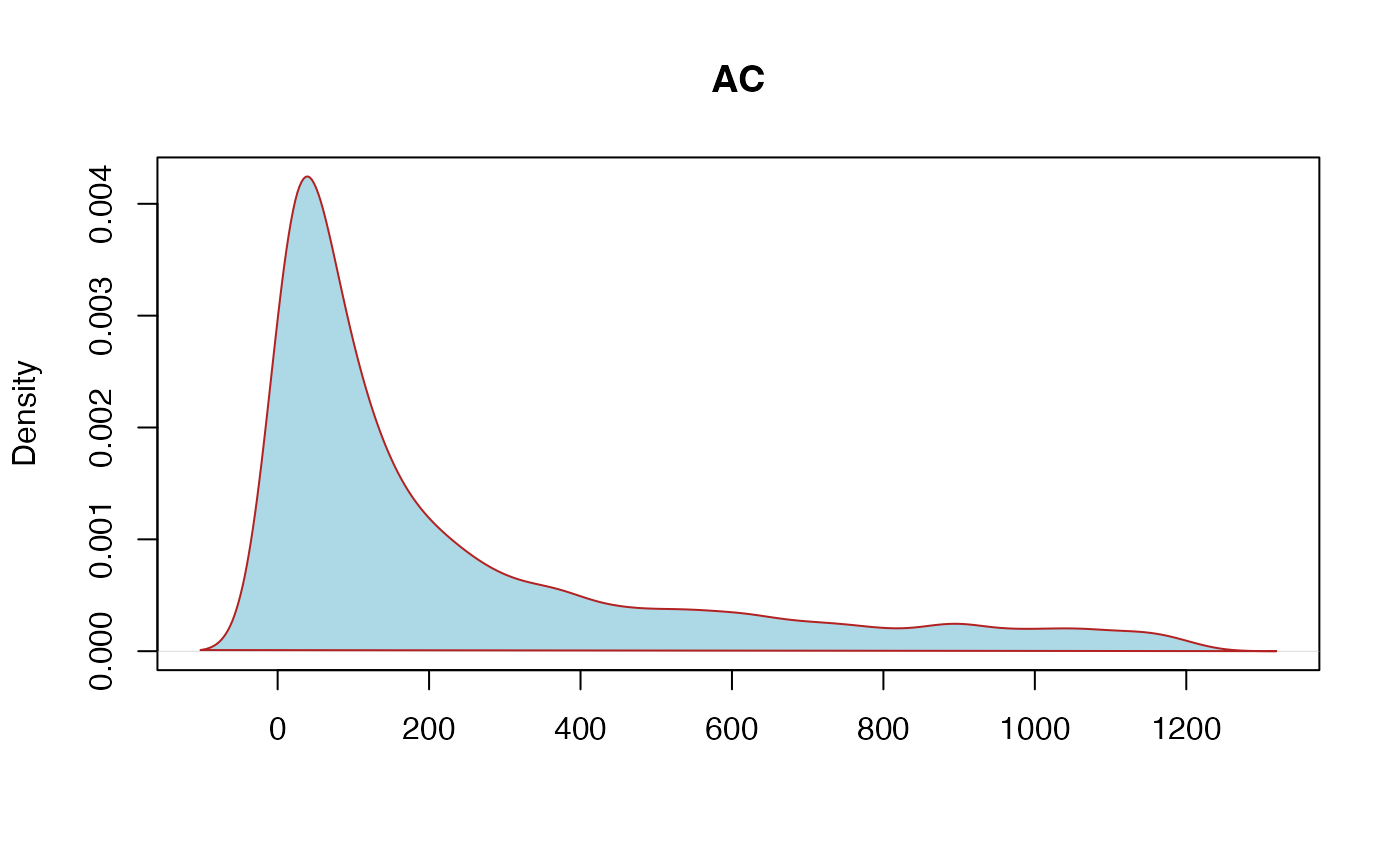
AC: Allele count
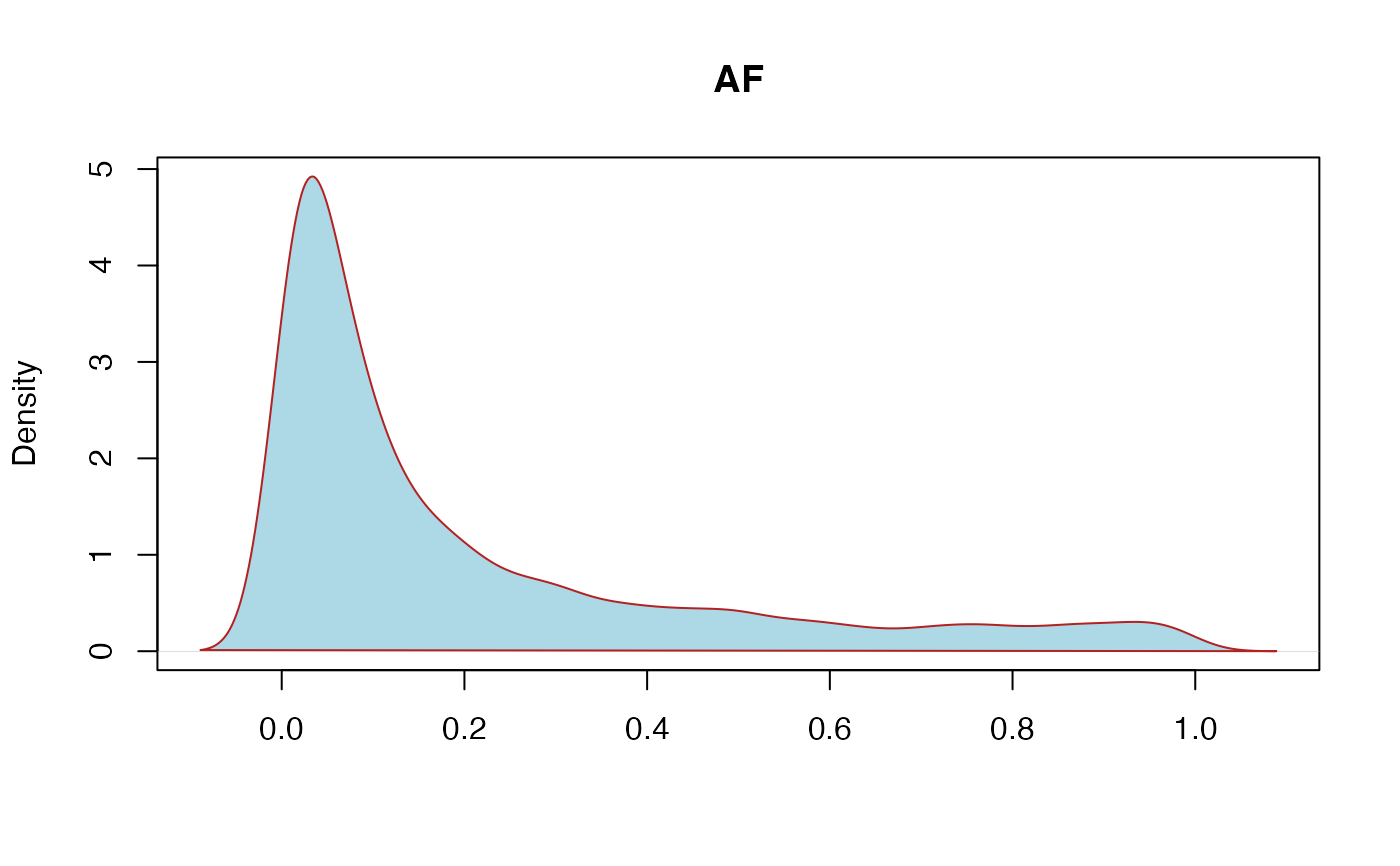
AF: Allele frequency
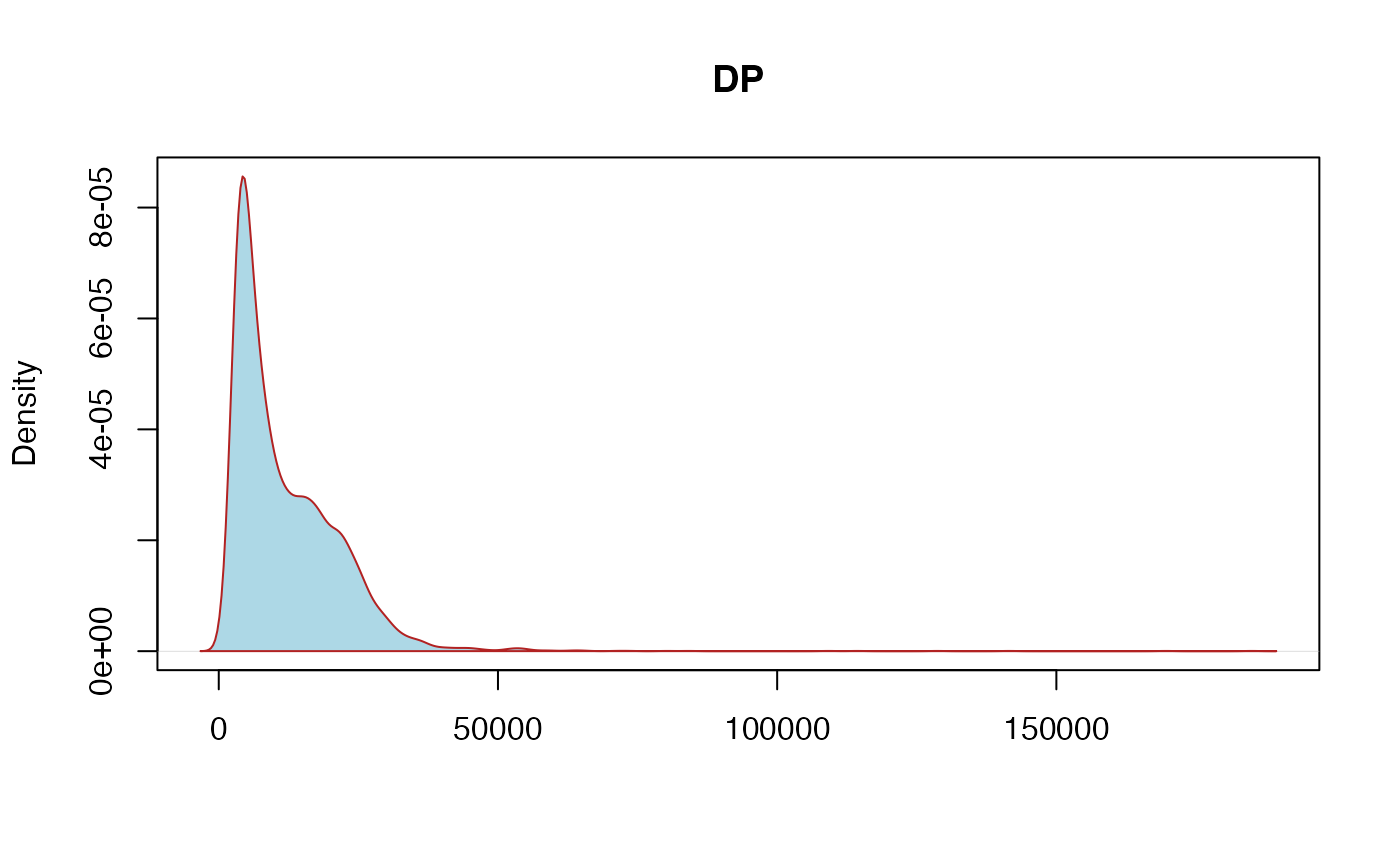
DP: unfiltered depth
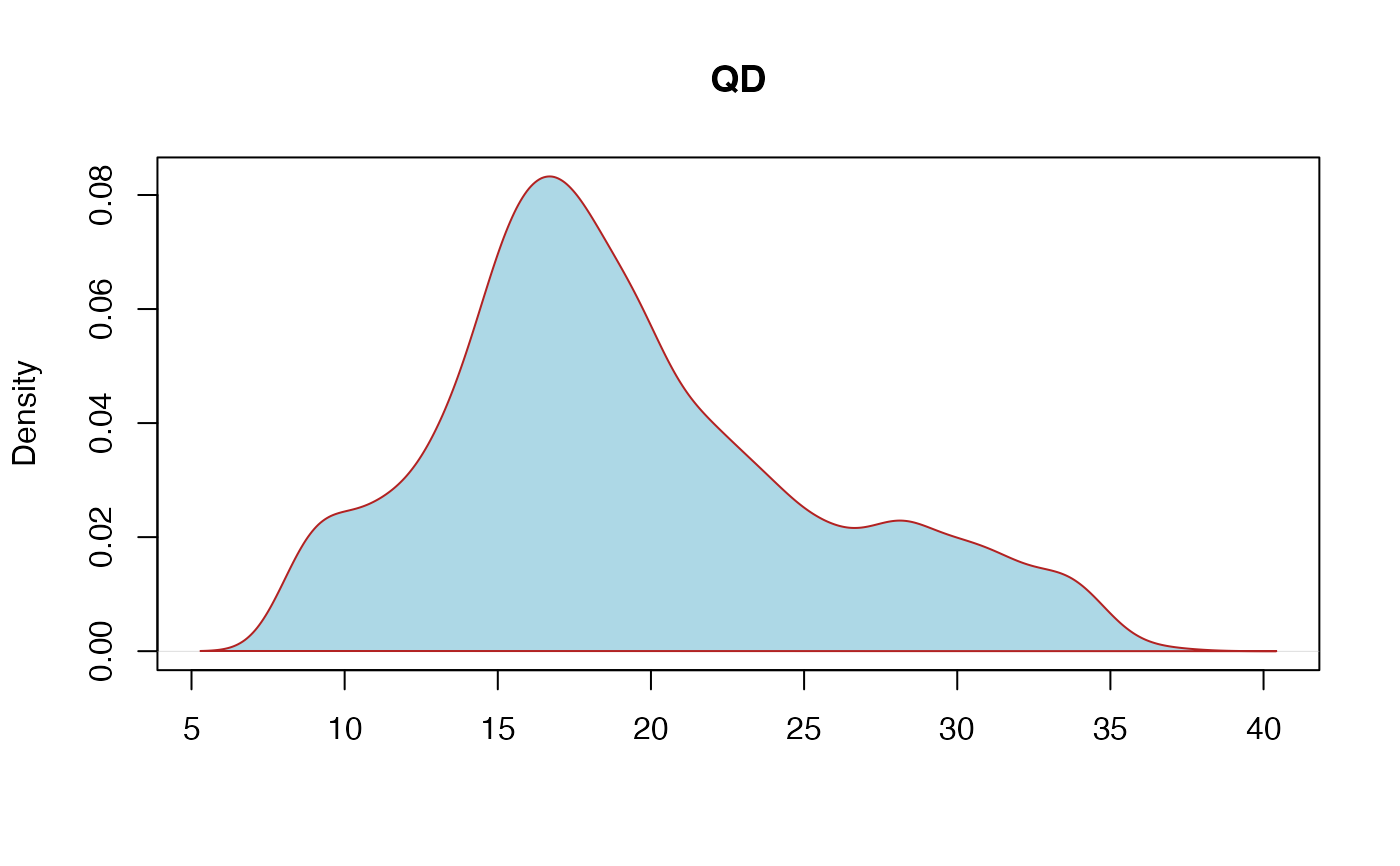
QD: QualByDepth - This is the variant confidence (from the QUAL field) divided by the unfiltered depth of non-hom-ref samples
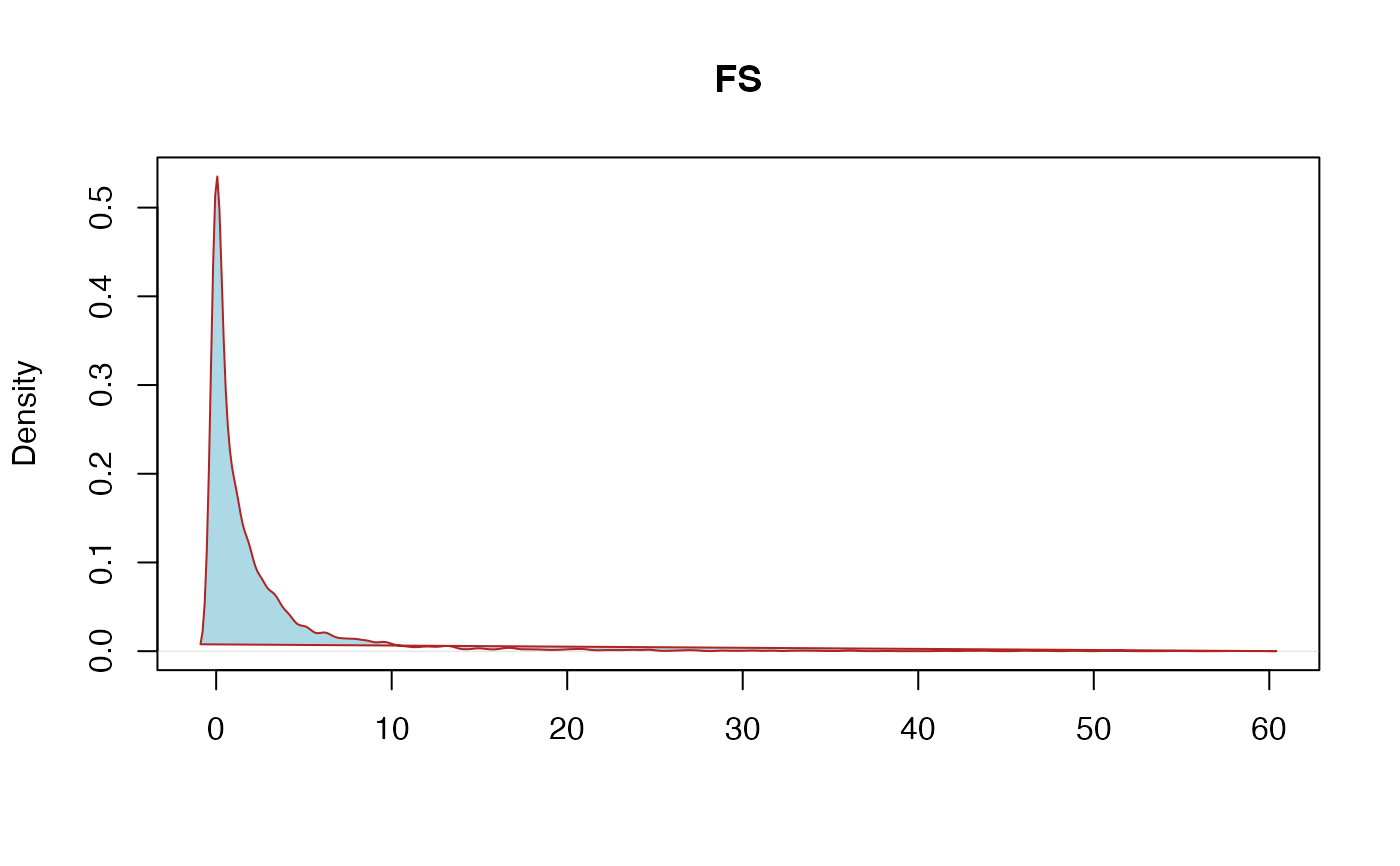
FS: FisherStrand - This is the Phred scaled probability that there is strand bias at the site
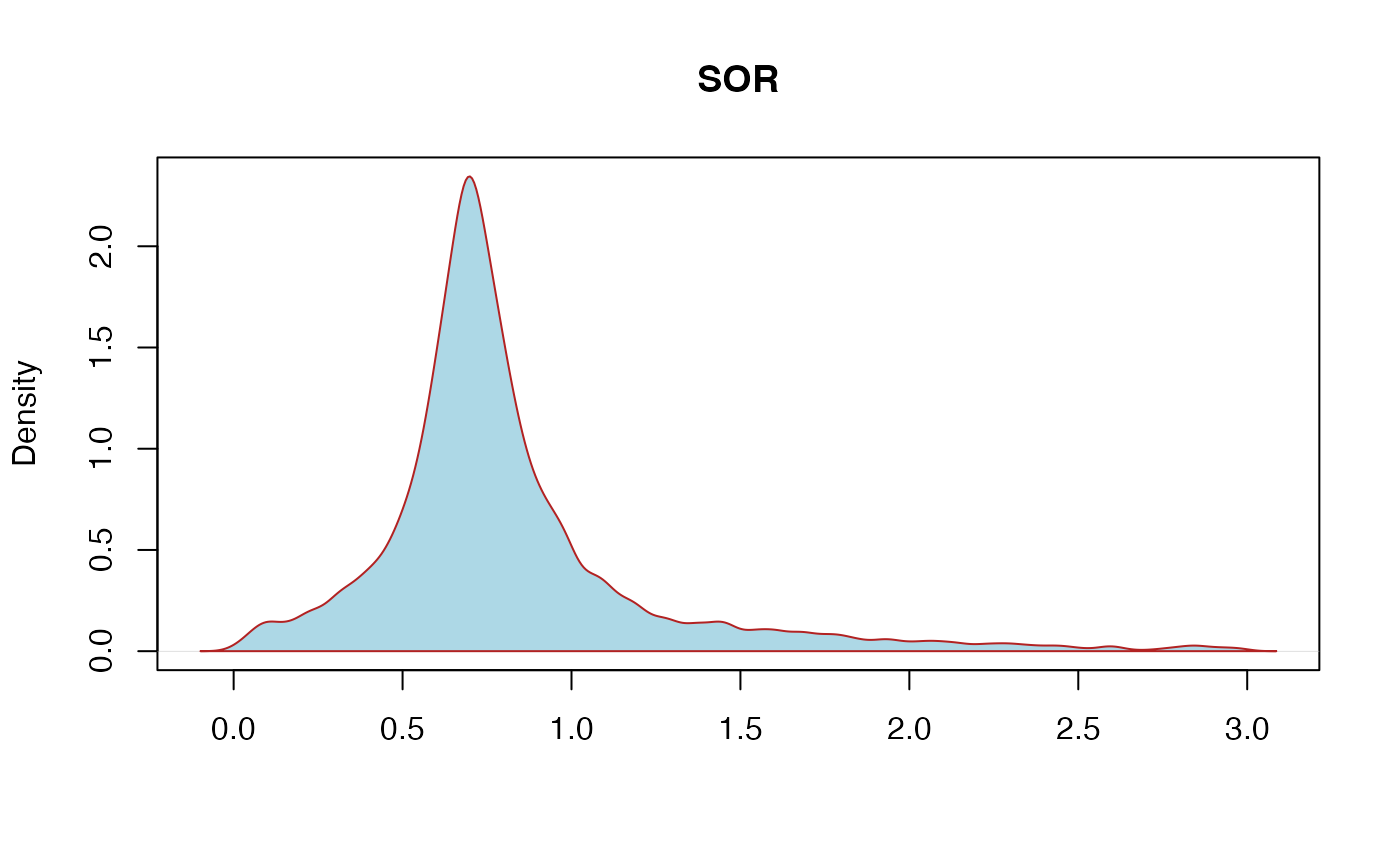
SOR: StrandOddsRatio - This is another way to estimate strand bias using a test similar to the symmetric odds ratio test
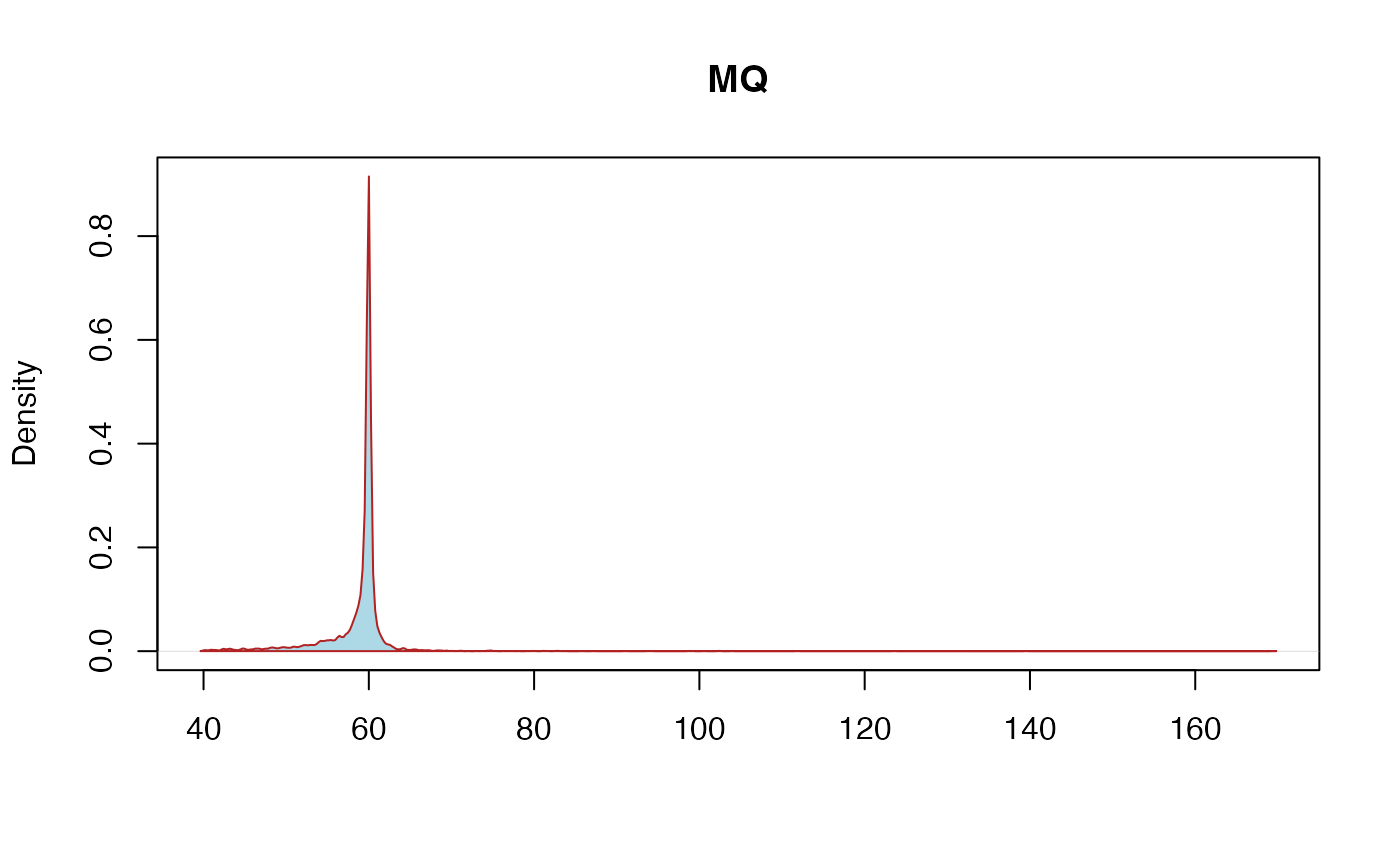
MQ: RMSMappingQuality - This is the root mean square mapping quality over all the reads at the site
MQRankSum: MappingQualityRankSumTest - This is the u-based z-approximation from the Rank Sum Test for mapping qualities
ReadPosRankSum: ReadPosRankSumTest: This is the u-based z-approximation from the Rank Sum Test for site position within reads
Examples
if (FALSE) vcf.file.path <- paste0(path.package("rCNV"), "/example.raw.vcf.gz")
vcf <- readVCF(vcf.file.path=vcf.file.path)
statistics<-vcf.stat(vcf,plot=TRUE) # \dontrun{}