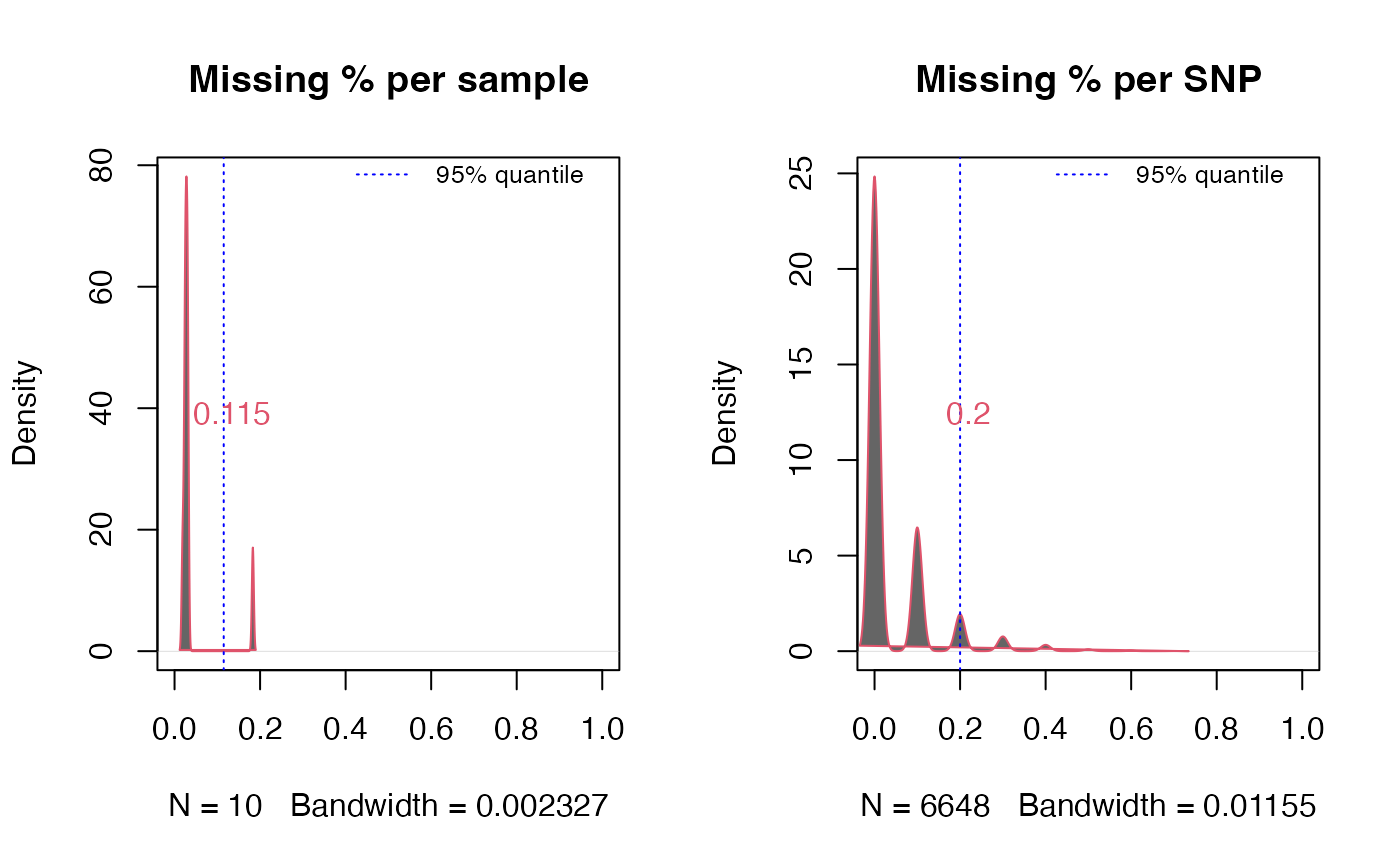
A function to get the percentage of missing data of snps per SNP and per sample
Usage
get.miss(
  data,
  type = c("samples", "snps"),
  plot = TRUE,
  verbose = TRUE,
  parallel = FALSE
)
Arguments
- data
a list containing imported vcf file using
readVCFor genotype table generated usinghetTgen- type
character. Missing percentages per sample “samples” or per SNP “snps”, default both
- plot
logical. Whether to plot the missingness density with ninety five percent quantile
- verbose
logical. Whether to show progress
- parallel
logical. whether to parallelize the process
Examples
if (FALSE) vcf.file.path <- paste0(path.package("rCNV"), "/example.raw.vcf.gz")
vcf <- readVCF(vcf.file.path=vcf.file.path)
missing<-get.miss(vcf,plot=TRUE) # \dontrun{}
#> generating table
#>
|
| | 0%
|
|===== | 10%
|
|========== | 20%
|
|=============== | 30%
|
|==================== | 40%
|
|========================= | 50%
|
|============================== | 60%
|
|=================================== | 70%
|
|======================================== | 80%
|
|============================================= | 90%
|
|==================================================| 100%
#> assessing % missing samples
#>
|
| | 0%
|
|===== | 10%
|
|========== | 20%
|
|=============== | 30%
|
|==================== | 40%
|
|========================= | 50%
|
|============================== | 60%
|
|=================================== | 70%
|
|======================================== | 80%
|
|============================================= | 90%
|
|==================================================| 100%
#> assessing % missing sites
#>
|
| | 0%
|
| | 1%
|
|= | 1%
|
|= | 2%
|
|= | 3%
|
|== | 3%
|
|== | 4%
|
|== | 5%
|
|=== | 5%
|
|=== | 6%
|
|=== | 7%
|
|==== | 7%
|
|==== | 8%
|
|==== | 9%
|
|===== | 9%
|
|===== | 10%
|
|===== | 11%
|
|====== | 11%
|
|====== | 12%
|
|====== | 13%
|
|======= | 13%
|
|======= | 14%
|
|======= | 15%
|
|======== | 15%
|
|======== | 16%
|
|======== | 17%
|
|========= | 17%
|
|========= | 18%
|
|========= | 19%
|
|========== | 19%
|
|========== | 20%
|
|========== | 21%
|
|=========== | 21%
|
|=========== | 22%
|
|=========== | 23%
|
|============ | 23%
|
|============ | 24%
|
|============ | 25%
|
|============= | 25%
|
|============= | 26%
|
|============= | 27%
|
|============== | 27%
|
|============== | 28%
|
|============== | 29%
|
|=============== | 29%
|
|=============== | 30%
|
|=============== | 31%
|
|================ | 31%
|
|================ | 32%
|
|================ | 33%
|
|================= | 33%
|
|================= | 34%
|
|================= | 35%
|
|================== | 35%
|
|================== | 36%
|
|================== | 37%
|
|=================== | 37%
|
|=================== | 38%
|
|=================== | 39%
|
|==================== | 39%
|
|==================== | 40%
|
|==================== | 41%
|
|===================== | 41%
|
|===================== | 42%
|
|===================== | 43%
|
|====================== | 43%
|
|====================== | 44%
|
|====================== | 45%
|
|======================= | 45%
|
|======================= | 46%
|
|======================= | 47%
|
|======================== | 47%
|
|======================== | 48%
|
|======================== | 49%
|
|========================= | 49%
|
|========================= | 50%
|
|========================= | 51%
|
|========================== | 51%
|
|========================== | 52%
|
|========================== | 53%
|
|=========================== | 53%
|
|=========================== | 54%
|
|=========================== | 55%
|
|============================ | 55%
|
|============================ | 56%
|
|============================ | 57%
|
|============================= | 57%
|
|============================= | 58%
|
|============================= | 59%
|
|============================== | 59%
|
|============================== | 60%
|
|============================== | 61%
|
|=============================== | 61%
|
|=============================== | 62%
|
|=============================== | 63%
|
|================================ | 63%
|
|================================ | 64%
|
|================================ | 65%
|
|================================= | 65%
|
|================================= | 66%
|
|================================= | 67%
|
|================================== | 67%
|
|================================== | 68%
|
|================================== | 69%
|
|=================================== | 69%
|
|=================================== | 70%
|
|=================================== | 71%
|
|==================================== | 71%
|
|==================================== | 72%
|
|==================================== | 73%
|
|===================================== | 73%
|
|===================================== | 74%
|
|===================================== | 75%
|
|====================================== | 75%
|
|====================================== | 76%
|
|====================================== | 77%
|
|======================================= | 77%
|
|======================================= | 78%
|
|======================================= | 79%
|
|======================================== | 79%
|
|======================================== | 80%
|
|======================================== | 81%
|
|========================================= | 81%
|
|========================================= | 82%
|
|========================================= | 83%
|
|========================================== | 83%
|
|========================================== | 84%
|
|========================================== | 85%
|
|=========================================== | 85%
|
|=========================================== | 86%
|
|=========================================== | 87%
|
|============================================ | 87%
|
|============================================ | 88%
|
|============================================ | 89%
|
|============================================= | 89%
|
|============================================= | 90%
|
|============================================= | 91%
|
|============================================== | 91%
|
|============================================== | 92%
|
|============================================== | 93%
|
|=============================================== | 93%
|
|=============================================== | 94%
|
|=============================================== | 95%
|
|================================================ | 95%
|
|================================================ | 96%
|
|================================================ | 97%
|
|================================================= | 97%
|
|================================================= | 98%
|
|================================================= | 99%
|
|==================================================| 99%
|
|==================================================| 100%